Full Report
Downtowns and Central Cities are vital to regional economies. Historically, they offered a centralized place for professional and government services, healthcare, and education. Over the last several decades, leaders have invested in Portland’s Central City as a place that is productive to work and is appealing to live. Following the numerous challenges throughout the Covid-19 pandemic, Portland’s Central City and Downtown neighborhoods struggled. But positioned as the gateway to the Greater Portland region and as the economic hub of Oregon, civic leaders and elected officials across all levels of government have dedicated significant energy to revitalizing Portland’s Central City to be a premier place to work, live, and recreate. One such effort was the Portland Central City Task Force, which brought focused attention to downtown Portland and its nine surrounding neighborhoods.
As the work began many questions were posed, but two were fundamental: what is the role of a central city and how important is it that it be saved?
The first draft of the central city’s role, or value proposition, came quickly and was refined across meetings: the region’s premier gathering place, a gateway to Oregon, an inclusive hub of innovation and opportunity, and a home to thousands who value its urban amenities and expanded supply of affordable housing. The vision was compelling and answered the first question.
And it didn’t take long for the community to answer the second one. More than 9,000 Portlanders responded to the task force’s online survey and nearly 300 people participated in one of 24 listening sessions focused on neighborhoods and key topic areas. The outpouring of support and engagement took organizers by surprise. Portlanders love their neighborhoods, and they want them reborn and reimagined for new generations.
Portland’s peer cities are experiencing similar challenges with varying outcomes. Over the next several years, it will be important to track Portland’s activity locally and in comparison, to peers in order to evaluate progress.
In this report, we document the first steps of the Central City recovery locally and in comparison with peer cities.
Report at a Glance

14%
Percent increase in Portland Central City foot traffic, compared to 2022.

4:1
Portland’s Central City has four jobs for every one housing unit.

94.7K
Density of foot traffic by acre in Portland’s Central City in 2023.

290K
Average square feet of leased building office space, down from 660,000 square feet before 2020.
Economic Data
The pandemic recovery has brought renewed attention to downtowns and central cities, but the definition of the “center” can differ. This comparison takes a closer look at our peers’ centers based on carefully constructed geographic borders drawn where job density tapers off. What did we find? The centers take 2-3 percent of the city’s geographic area, with the exception of the more spread out Milwaukee. Five-to-ten percent of the city’s populations live in the center, and Portland sits in the middle at seven percent. Typically, more than 80 percent of the city’s workers are located in the center. Here Portland appears to be outlier at 70 percent, but another 10 percent of workers are located just outside the center at Oregon Health Science University (OHSU). See Figure 1.
Overall, foot traffic in Portland’s Central City and its peers continue to climb. Portland falls in the middle between peers when measuring a change in foot traffic from 2022 through 2023. Sacramento and Milwaukee have seen the least change, whereas Seattle and Minneapolis have increased 18% and 20% respectively. See Figure 2.
When comparing the share of foot traffic by type of person between Portland and its peers, Portland’s Central City is most similar to Denver. Both cities have approximately one fifth of foot traffic from residents, another quarter of foot traffic from employees, and remaining foot traffic from visitors. Visitors makeup just over half of all foot traffic in Milwaukee and Seattle, but Seattle has a higher share of employees in its Central City. See Figure 3.
As cities across the country continue to establish a new normal and move away from traditional central business districts, the mix of uses will be increasingly important. More uses that serve residents and attract visitors will contribute to more vitality. Therefore, evaluating the relationship between jobs to housing in central cities, or the ratio of jobs to housing units, is a metric we will begin tracking year over year. In 2023, Portland had a lower ratio, therefore a higher concentration, of jobs to housing units at 4 to 1. This is considered a stronger mix compared to other peer cities such as Sacramento with 6.6 jobs to housing units or Minneapolis with 10.2 jobs to housing units. Those cities continue to rely more heavily on employees frequenting their downtowns, rather than residents. See Figure 4.
In comparison to peer cities, Portland doesn’t have as much foot traffic. While it has a comparable amount of foot traffic to Sacramento, Portland covers a much larger area. On the other hand, cities like Seattle and Minneapolis have significantly higher foot traffic per acre in their more compact city centers. This means that, proportionally, more people are walking around, dining at restaurants, shopping at businesses, and adding to the vibrancy of urban life compared to Portland. As acclaimed urbanist Jane Jacobs stated, eyes on the street leads to safer and livelier neighborhoods. See Figure 5.
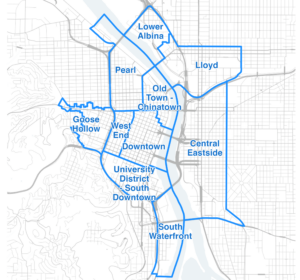
Portland’s Central City is not a monolithic neighborhood with similar conditions throughout. Rather, it’s a city of neighborhoods, or subdistricts, each with their own characteristics and relative economic vitality. Some subdistricts, such as the Pearl and South Waterfront, do not show remarkable improvement in foot traffic from the last year, largely because they were not as negatively impacted by pandemic-related challenges. As we discuss below, these subdistricts also have a stronger mix of uses which results in more resiliency. Subdistricts that faced more challenges, such as Lloyd and Lower Albina, are seeing greater improvement in foot traffic over the past year. See Figure 6.
The Central City has four neighborhoods with a rough 25/20/55 mix of residential, employee, and visitor traffic: Goose Hollow, Pearl, South Downtown, and South Waterfront. That mix is associated with 2023 activity that’s close to pre-pandemic levels. The residential base helps. The other six neighborhoods rely more on traffic coming from elsewhere, have seen larger declines in activity, and are dependent on improved safety conditions to recover. And in the longer term, these six neighborhoods would benefit from the development of more housing. See Figure 7.
Subdistricts in Portland’s Central City have a broad range of employment uses and housing. More residential subdistricts, such as the South Waterfront, the West End, Goose Hollow and the Pearl, have fewer than 2 jobs for every housing unit. Conversely, Downtown has 19 jobs for every housing unit, which means fewer people call downtown home. To activate traditionally employment-centric neighborhoods, also including Central Eastside and Lloyd, more residential developments will need to be completed. See Figure 8.
Foot traffic per acre ranges from a few hundred in Lower Albina to over 3,000 in the West End and Downtown. Five subdistricts hover around foot traffic of 2,000 visits, which may continue to increase with enhanced community safety and a larger mix of uses. See Figure 9.
Vacant office space in the Central City exceeded eight million square feet in the fourth quarter of 2023–more than double the pre-pandemic level. The total should continue to climb as leases expire and tenants either downsize or relocate. Making productive use of the space will be the work of the next decade or more. A small share of the space may lend itself to residential conversion. Beyond that, building owners will look for other creative uses–innovation hubs, co-working spaces, education or community event centers–to make use of the properties until regional job growth brings demand back into line with supply. See Figure 10.
Consistent with the rising vacancy rates, the leasing volume of Central City offices since 2020 is half the level seen during 2013-2019. Buildings leased an average 290,000 square feet of space each quarter since the second quarter of 2020–down from 664,000 square feet per quarter during the seven years leading up to the pandemic. Notably, leasing volume declined in every quarter since the beginning of 2022 except the third quarter of 2023. See Figure 11.
Why This Matters
Similar to the overall state of our economy, whatever gains were attributable to the post-pandemic recovery and lifting of health measures, have been obtained. The vibrancy of centralized neighborhoods is shifting to a higher reliance on residents and visitors than they have in the past. This is also evident in Portland’s new peer cities, which we will continue to track for the next several years.
In the near term, Portland’s Downtown and Central City must enhance visitor foot traffic through public safety measures and activating vacant spaces and events, rather than relying on an influx of employees returning to their offices full time. Hybrid work has become normalized and any meaningful recovery in return to work is likely complete. Ongoing recovery efforts must look beyond attracting office workers; the Central City needs more residents and more visitors, both from tourists and those living in other parts of the region.
The good news is that residential foot traffic could see a substantial rise if planned developments are successfully implemented. In the near term, Portland should anticipate a continued increase in office vacancies, driven largely by expiring leases and tenants opting for smaller spaces or to move away. It will be crucial to reimagine new uses and to attract a diversity of new tenants to create vitality in office spaces.
This report is presented to you by:

Value of Jobs Coalition Partners