
Last year will be remembered as the year the U.S. transitioned from re-opening to the recovery phases of the pandemic. At the beginning of 2022, Portland saw a sharp increase in Covid inflections linked to the highly contagious omicron variant. As Covid’s severity waned and restrictions lifted, in-person meetings and conferences returned, and employers grappled with remote work policies. Economically, the regional and state’s public health restrictions were some of the first introduced and last to lift. Resultingly the region saved lives but lagged in key economic indicators relative to its peers. Concurrently, Portland began seeing elevated crime rates that outpaced other major cities. This, coupled with reputational challenges, have led to a variety of headwinds that we will explore within this year’s report.
The year will also be remembered for high inflation, and the Federal Reserve’s attempts to curb it. Consumer price inflation, measured year-over-year, had accelerated throughout 2021 and into 2022. In March, the Federal Reserve initiated a series of increases to its benchmark Federal Funds Rate to slow the pace of economic activity. Inflation and job growth persisted despite the rate increases as consumers with pent-up, post-pandemic demand and excess savings absorbed the higher costs of goods and services. As the year ended, inflation was high but starting to decline, and most economists are predicting a mild recession beginning in 2023.
The Portland region returned to its pre-pandemic job level in August 2022—just one month after the nation did. The region outpaced U.S. job growth in 2022 making up for below average growth in 2021. But the region’s middling performance masked highly uneven sub-regional trends. Downtown Portland is challenged with high and rising office vacancy rates as hybrid work behaviors and policies take hold, alongside a rapid increase in crime rates. And some hypothesize that an abrupt shift in the level of local taxes and services in tri-county Oregon from 2019 through 2021 could be contributing to intra-regional moves to from tri-County Oregon to Clark County.
If trends continue, the economic outlook, especially for the City of Portland, is as concerning as any time since the twin recessions of the 1980s. Newly released census data suggests the region can no longer take net in-migration for granted—as it has for most of its history. People and businesses vote with their feet, and they are not voting for Portland, the city or the region, in the way they have in the recent past. The persistence of that trend could lead to a stagnant and underproductive economic future for our region.
Report at a Glance
Economic Recovery
* NOTE: In this report, the Portland region refers to the Metropolitan Statistical Area (MSA) of Portland-Vancouver-Hillsboro, OR-WA, except where otherwise noted. Metrics also compare the Portland region to other metropolitan “peer” regions. These comparator regions were selected and based on a number of indices found in the U.S. Census Data. Data and analysis provided by ECONorthwest.
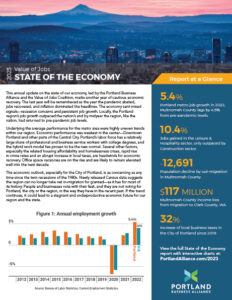
Portland metro employment grew faster than the U.S. in 2022
Regional job growth outpaced the U.S. average in 2022 after slow job performance during 2020 and 2021. Consumer behavior and regional Covid-policies explain most of the difference. Regional consumers were slower to return to restaurants, hotels, and entertainment venues than peers across the country, in part because of periodic governmental restrictions, but also due to elevated concerns about infections with new variants. As the severity of Covid infections eased during 2022, Portland’s recovery accelerated and outpaced the national average. See Figure 1.
Jobs recovered across the state but declined in Multnomah County
Jobs levels in Washington and Clackamas counties, and the State of Oregon, had nearly or fully returned as of December 2022. Notably, Multnomah County’s job count was still down 4.5% compared to pre-pandemic levels. Multnomah County has a sizable leisure and hospitality sector, concentrated in Portland’s Central City that has not fully recovered. Additionally, like many other metros across the country during the pandemic, the geographically centered, densely urbanized county has lost jobs to the suburbs and outlying areas. See Figure 2.
Construction and leisure/hospitality industries added the most jobs in the last year, but trade, transportation and utilities are lagging
After below average job growth in 2021, the Portland region accelerated in 2022 and recovered its pre-pandemic jobs level around the same time the nation did. The construction sector led the way with a 10.7% annual increase thanks to strong growth in the residential sector. Next was the leisure and hospitality sector as restaurants, hotels, and entertainment venues anticipated the end of physical distancing requirements and hired aggressively to meet pent-up consumer demand. The retail and wholesale trades were the weak spot as consumers, who had loaded up on goods purchased during the pandemic, spent more on services. See Figure 3.
Portland’s lower income households lost ground relative to the U.S. metro average from 2019-2021
Portland metro’s median household income, the 50th percentile (or, typical) household, was 115% of the U.S. metro average in 2021—in roughly the same relative position as in 2019. Lower income households did not keep pace with their income peers across the country from 2019 to 2021. That’s likely because lower income households in economies that re-opened faster could take advantage of the tight labor markets and strong wage growth in the leisure and hospitality sector.
Portland high-income households saw relative gains and, in 2021, the 95th percentile household had a U.S. metro average income. The region’s small number of corporate headquarters and under-sized financial services sector contribute to Portland’s weaker relative performance at the high end of household incomes. See Figure 4.
Median household incomes for Black and Asian-headed households improved during the pandemic
Gaps in household incomes, measured by the race/ethnicity of the household head, narrowed from 2019 to 2021 but remained sizable. An unusually tight labor market during 2021 led to strong wage growth—especially for low-to-middle wage workers—and contributed to the increase in median household incomes overall. Estimates due to the smaller sample size and resulting increased margin of error for American Indian & Alaska Native, Native Hawaiian & Pacific Islander, and some other races may not be reliable. These trends are encouraging towards a more equitable region, upcoming data will be important to monitor to determine if these trends continue, or are related to margin of error and revert back to lower pre-pandemic levels. See Figure 5.
The U.S. census data estimates show sizable Multnomah County out-migration but Clark County growth
Recent U.S. census population estimates suggest that only Clark County had a meaningful increase in population in 2021—driven almost exclusively by net in-migration. All four counties show low levels of natural population change (the number of births outnumbering deaths in the incumbent population), which is a function of an aging population and decreasing fertility rates. Multnomah County’s sizable population decline parallels those of other densely urbanized, metro centers.
Slow population growth is a troubling sign for our regional economy, and this was highlighted in last year’s State of the Economy report. This year’s data is even more startling with Clark County as the only county in our region to show a meaningful increase in population. Whereas Multnomah County showed barely any natural population growth offset by a steep decline in net in-migration by 12,691 people. See Figure 6.
The census estimates differ with preliminary findings by Portland State University’s Population Research Center. The PSU center estimates that Multnomah County’s population fell by only 3,000 in 2021. The estimates draw on different underlying data sources. The census has access to addresses used for federal tax filings and PSU draws on driver’s license and jobs data.
Portland drops from 49 to 56 in ULI development opportunity ranking
Real estate professionals continue to be bearish about the region’s development outlook. From 2020 to 2021, Portland fell from the top to the bottom quarter of regions on the annual Urban Land Institute (ULI) development opportunity ranking, when previously the region topped the charts at 3 in 2017. For 2023, Portland remains in the bottom one-third of all 80 regions for real estate prospects. Most of our peer cities—Nashville, Austin, Seattle, and Salt Lake City—are in the top quartile. See Figure 7.
Apartment production up from bottom a year ago, likely headed back down
Apartment construction rebounded from pandemic lows to 10,464 units in 2022 regionally, nearly to the highest levels recorded from 2016 to 2019. However, permitting activity suggests the pace of production will fall over the next year with limited access to capital and higher interest rates. See Figure 8.
Portland’s Peers
Portland has second slowest jobs recovery among peers
The Portland region returned to its pre-pandemic job level in June 2022, but jobs recovery lags those of our peer regions Austin, Nashville, Salt Lake City, and Indianapolis. Portland and Seattle’s underperformance on jobs is largely explained by different community attitudes and responses to the pandemic. Along the entire west coast of the U.S., public health restrictions and a relatively virus-cautious public slowed the rebound of the leisure and hospitality sectors. See Figure 9.
Portland median household income increased 1% from 2019 to 2021, 3rd among peers
The region’s median household income—adjusted for regional prices—ranked 4th among Portland’s peers. Portland’s price adjusted MHI was $79,642 in 2021—lower than Seattle, Austin, and Salt Lake City but higher than Nashville and Indianapolis. The price adjustment reduces Portland’s nominal median household income by $4,301 in recognition of the higher than national average costs of living in the region. In Portland, the higher costs are driven by the undersupplied market for housing. See Figure 10.
Portland’s GDP per capita grew 12 percentage points less than Seattle’s during 2016-2021
Rankings of pre-pandemic Gross Domestic Product (GDP) growth are like rankings of price adjusted MHI. Portland falls behind Seattle, Austin, Salt Lake City, and Nashville and ahead of only Indianapolis. See Figure 11.
Portland is third highest among peers for remote work
Portland and its peers experienced sizable, and potentially permanent, increases in the share of people working from home. The regions share similarities in their industrial makeups and have relatively high shares of professional service jobs that lend themselves to remote or hybrid work. See Figure 12.
Why this matters
Portland and the nation are in unusual economic times. The Federal Reserve tried to slow the economy while consumers, boosted by excess savings, continued to spend during 2022. Meanwhile, remote work altered the relationships employers and employees and redefined where work is done.
All this change has rendered economic strategies, developed just a few years ago, obsolete.
At the same time, no other place in the country has such widely varying methods of taxation within a single commuting area as the Portland region. And recent years have seen an abrupt expansion of services and taxes on the Oregon side of the border—especially in the City of Portland.
Economic theory suggests that households and businesses will find a location within the region that matches their service and tax preferences. With remote work allowing more mobility than ever before, where will that be? How will those decisions impact our region and state?
This report is presented to you by:

Value of Jobs Coalition Partners


Related Reports
 February 2023
2023 Regional Tax Comparison
 February 2023
2023 State of Downtown & the Central City
 February 2023