
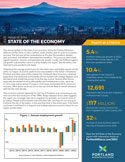
2023 State of the Economy
executive summary (pdf)
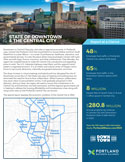
2023 State of Downtown & the Central City
executive summary (pdf)
Household Location and Taxes
Income loss from migration to Clark County from tri-county Oregon is growing
The U.S. Internal Revenue Service (IRS) tracks year-to-year migration patterns at the state and county levels. The patterns are available for inflows (e.g., residents who moved to a state or county and where they migrated from) and outflows (e.g., residents who left a state or county and where they went). The IRS reports the number of tax filers who moved and their associated adjusted gross income.
The annual reporting shows consistent net income flows from Clackamas, Washington, and Multnomah counties to Clark County with a single exception—a net flow from Clark County to Clackamas County from 2011 to 2012. See Figure 13.
Growth in average capital gains income was fastest in Clark County from 2011 to 2020
The IRS also provides a high-level disaggregation of taxable income at the county level. Average net gains grew in all four counties from 2011 to 2020 due, in part, to strong equity and housing markets during that period. Growth was fastest in Clark County, where the average net gain increased from $13,784 to $38,191. The absence of a state capital gains tax in Washington likely contributes to the strong growth of that income in the county. See Figure 14.
Household Income of People Moving into Clark County, WA from Tri-County Oregon in 2019
In 2021, Portland metro saw migration from Clackamas, Multnomah, and Washington counties to Clark County. Almost one-quarter of these households had annual incomes in the $40,000-$60,000 range and about one-third had annual incomes above $100,000. Should these recent inter-regional migration patterns continue, with population growth in Clark County outpacing growth across tri-county Oregon, it will be increasingly important to understand the underlying drivers of these moves. See Figure 15.
Business Location and Taxes
Business taxes are a second-tier factor in location decisions. Businesses typically have a strong reason for selecting a particular region with access to labor, consumer markets, and supply chains topping the list along with a founder’s or corporate leadership’s preferences. But taxes do matter. Studies of inter-regional tax differences, between two regions, suggest a 10% increase in business taxes is associated with a 1% to 6% decrease in business activity.
Economists find business taxes matter more in intra-regional location decisions. Once a business has chosen a region, its top-tier requirements can be satisfied from different locations within the region. It has similar access to labor, customers, supplies, and other amenities in different sub-regions. Given comparable access to its top requirements, a business can then shop within a region for a mix of local taxes and services that matches its needs. Therefore, taxes do play a consequential role in within region location decisions. And meta-analyses suggest that net 10% increase local taxes—relative to nearby jurisdictions —is associated with a 15% decrease in business activity.
Of course, taxes come with corresponding services and if tax increases translate into services or outcomes that are valued by businesses (e.g., a well-trained workforce, well-managed transportation systems, etc.), the high-quality public services can boost business activity.
Business tax receipts up 32% from 2019 to 2021 in City of Portland
The global tax consultancy Ernst & Young recently evaluated changes in state and local taxation in Portland and across the state. They calculated total taxes paid by businesses located in the City of Portland increased by about one-third, or from $781 million to $1.031 billion, from 2019 to 2021.
Key changes during that three-year period, included implementation of a gross receipts tax for the Portland Clean Energy Fund, a property tax to fund city parks, a rate increase in the Multnomah County business tax, an income tax to support Preschool for All (paid in part by sole proprietors), property taxes for Multnomah County library renovations, and new business and personal taxes associated with Metro’s Supportive Housing Services measure. Ernst & Young estimates that the business share of local level taxes in Portland rose from 56.5% in 2019 to 64.8% in 2021. See Figure 16.
Analysis of business taxes across the region shows the highest tax burden in Portland and lowest in Vancouver
As businesses evaluate jurisdictions for location or expansion, many will conduct detailed estimates of their tax liabilities. ECONorthwest replicated this comparative exercise for three types of businesses evaluating Portland, Beaverton, Lake Oswego, and Vancouver locations and taxation levels. Two businesses are manufacturers—one makes food products and one makes hand tools. The third business is an engineering services firm.
Business characteristics—sales, number of employees, building square footage, gross income, and pretax earnings—were drawn from the IBISWorld market research firm and reflect a median, or typical, firm in that industry. The engineering firm is a small, higher profit operation. The manufacturers are comparably sized with about 30 employees and sales between $10 and $13 million annually.
The analysis makes three important assumptions:
- the businesses can operate identically in each of the four cities;
- they pay taxes as corporate entities and not through individual owners; and
- they export 75% of the goods and services produced outside of the Pacific Northwest.
The latter assumption is critical because several state and local taxes are designed to the advantage of traded-sector business and assess taxes on only local sales.
The analysis was comprehensive and considered a broad range of taxes including payroll and corporate income taxes at the federal level; corporate income, gross receipts, unemployment insurance, and workers’ compensation taxes at the state level; and property, payroll, corporate income, gross receipts, business license taxes at the local level.
Pretax earnings, expressed as a share of sales (or revenue), ranged from 8% for the food manufacturer to 24% for the engineering services firm. Business taxes range between one-third to one-half of pretax earnings, depending on the type of business and jurisdiction.
For all three examples, business taxes are lowest in Vancouver and highest in Portland. The hand tool manufacturer, for example, has after-tax earnings equal to 6.2% of sales in Portland. Locate in Vancouver with identical performance, and after-tax earnings increase to 7.8% of sales—or by $168,892. See Figures 17-19.
Portland’s higher level of business taxation dates to the enactment of corporate income taxes levied by the City of Portland and Multnomah County in 1981. These local-level business income taxes are not common in other cities across the U.S. The gross receipts tax to fund clean energy programming, enacted in 2019, added a second sizable tax with a narrow geographic focus.